DFX: OEE Software for Food and Beverage Manufacturing

DFX, the AI-Native MES for food and beverage, turns OEE from a number on a screen into an accurate, actionable one. It captures stops and speed losses straight from the line, grounds them in the same record as production and quality, and ranks each loss by cause, machine, SKU, and hour, so improvement work starts where it costs the most.

Turn scattered losses into one measure of line performance

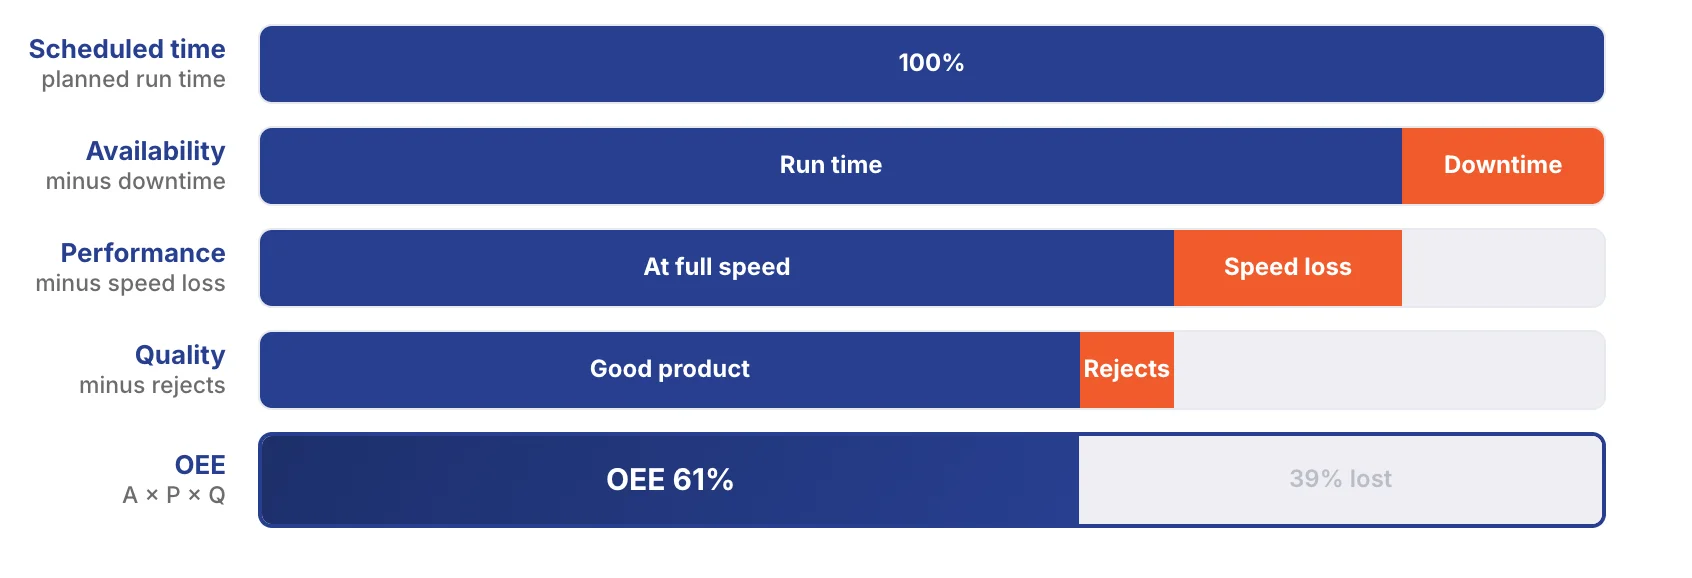
OEE is the share of scheduled time a line spends making good product at full speed, calculated as Availability, Performance, and Quality, so every hidden loss shows up in a single number.

Any tool can put an OEE gauge on a screen. The real questions are whether you can trust the number and whether it tells you what to do next.

DFX records every stop before the number is calculated

DFX records what happened, why, and where it came from the moment a machine stops in real time. Stops the machine cannot see, like a maintenance hold, are booked by the operator on the same timeline, and the AI-native MES tracks booking compliance, so the record stays complete without relying on end-of-shift memory.

1
Detect

DFX reads the stop from the machine the moment it happens over the standard protocols it already runs on.

2
Check

It checks whether the stop was planned, like a sanitation cycle or changeover, or unplanned.

3
Classify

The PLC fault code maps to your downtime reason code, so the stop is labeled automatically.

4
Trace to source

It checks whether an upstream stop starved the line or a downstream jam blocked it, and attributes the loss to the machine that actually caused it.

5
Present

The loss lands in the one live production record and rolls up into Availability and OEE, ranked by what it costs.

Turn losses into a shortlist

DFX categorizes the losses behind it automatically and ranks them worst first, so improvement work starts with the losses that cost the most time

Losses categorized automatically
DFX assigns each loss a reason category, a specific reason code, and the exact workcenter, so a recurring equipment problem is easy to separate from a one-off event.
Speed losses captured
Slow-running time goes unrecorded in most OEE tools. DFX captures it and breaks performance loss down by day, machine, reason, and SKU.
Ranked through Pareto analysis

The top downtime reasons, the machines pulling down availability, and the SKUs that run poorly are ranked in order, so teams work the losses that matter most first.

Recurring patterns surfaced
An hourly heatmap of machines against hours of the day exposes losses that repeat, like startup losses in the first hour of a shift or quality drift on long runs.

Cut X% downtime → +Y OEE

See the payoff before you spend

Pick a downtime problem and the share of it you could realistically close. DFX estimates the OEE you would gain, so you start with the fixes that give the most back.

Built for the operating realities of food and beverage

Beverage and food lines lose and recover time in ways generic OEE tools do not account for.

Sanitation and changeovers booked as planned
Wet cleans between flavors and allergens, clean-in-place, and format changeovers are a routine part of a food and beverage shift. DFX books them ahead as planned downtime, so availability reflects real losses, not scheduled hygiene.
Performance measured per SKU
One line runs many pack sizes and formats, each at its own rated speed. DFX baselines performance per SKU, so a slow-looking day reads as a heavier product mix, not a false loss.
Losses traced to the bottleneck
A food and beverage line moves at the pace of its bottleneck, where an upstream stop starves it and a downstream jam blocks it. DFX attributes the lost time to the machine that actually caused it, not the one that happened to stop.
Every loss tied to a batch
Food and beverage is batch made and regulated. Because production, downtime, and quality live on one record, every OEE loss sits with the same batch and shift as the quality hold or reject it produced.

Proven across live food and beverage deployments

200+

lines connected

8%

average OEE improvement

170+

plants live

XXM+

cases traced annually

Case study snapshot

Pernod Ricard: Scaling operational intelligence across 30 facilities

Pernod Ricard: Scaling operational intelligence across 30 facilities

Altizon’s DFX Platform unified Pernod Ricard’s production, quality, and sustainability data by replacing fragmented, paper-based…

Large Beverages Major: Standardizing performance across multi-OEM bottling lines

Large Beverages Major: Standardizing performance across multi-OEM bottling lines

Altizon’s DFX Platform helped large beverages major connect multi-OEM bottling lines and utilities into a…

Frequently asked questions (FAQs)

85% is the figure most often cited as world class, but a realistic target depends on your equipment and product mix. What matters more than a universal benchmark is measuring each line against a target that fits it. DFX lets you set a corporate OEE target and override it per plant, so every line is judged against the right bar.
OEE software measures and reports the effectiveness number. An MES also captures the underlying production, downtime, and quality record that number comes from, and connects it to traceability, compliance, and execution. DFX is an AI-Native MES, so its OEE sits on the same live record as everything else on the line. See the MES software overview for the full picture.
Mostly, yes. Machine stops are read from the line, with PLC fault codes mapped to your downtime reason codes, so a stop is recorded automatically with a reason attached. Many granular fault codes can map to a single reason code, which keeps the analysis clean. Operators only book the stops the machine cannot see, like a maintenance hold, and DFX tracks booking compliance so the record stays accurate without relying on memory at the end of a shift.
It compares actual output against the rated speed for the product running, and records the gap as performance loss. Those losses are then broken down by day, machine, reason, and SKU, the same way stops are. This surfaces the minor stops and slow running that most OEE tools miss but that often cost the most on high-speed lines.
Because they lose time differently. Sanitation and changeovers between flavors or allergens are planned downtime, not failures. Every SKU runs at its own rated speed, so performance has to be measured per product. And the line runs at the pace of its bottleneck, where an upstream stop starves it and a downstream jam blocks it. DFX accounts for each of these, so the number reflects how a food and beverage line actually runs.
It depends on where your losses are, which is exactly what DFX measures first. On high-speed beverage lines, closing small, frequent stops has contributed to OEE improvements in the region of 8%. Rather than promise a single number, DFX estimates the OEE gain from closing a given share of downtime, so you can size the opportunity on your own lines before investing.

Ready to see your true OEE?

Start with the line that matters most and see your losses ranked by what they cost, live in weeks.